In an ideal world, we write bug-free code. In the same universe, we don’t have to struggle with marketing our indie games, and we are skilled in design, programming, graphics and audio. Today I’ll try to make fixing bugs easier and faster for you, so you’ll have more time for more enjoyable tasks. Welcome to the second part of the series about making debugging an (almost) pleasant experience for you.
Fixing bugs is difficult enough. You don’t want to add ‘What the fuck is this shit’ on top of that. In the previous post – 7 good code practices that will help you in debugging – we tried to get rid of those unpleasant thoughts, so in this one, we’ll be dealing with a pure puzzle solving. That is because bug happens. So let’s get into it.
‘Debugging’ series
Part I – 7 good code practices that will help you in debugging
Part II – Easy method to fix bugs in your game (this)
Content
6 steps of debugging
Easy to use tools and real-life example
6 steps of debugging
Every issue is different, so it is not possible to write exact workflow for every one of them, so we’ll generalize it a bit. One more thing. I use this workflow. It worked for me when I had to fix bugs in my code, as well as bugs in huge codebases that I didn’t contribute in writing at all. I worked it out, and I want to share it with you. It doesn’t have to be as fabulous for you as it is for me, but if you don’t have your workflow, I believe this one is a great start. And after that, I’ll show you a real-life example.
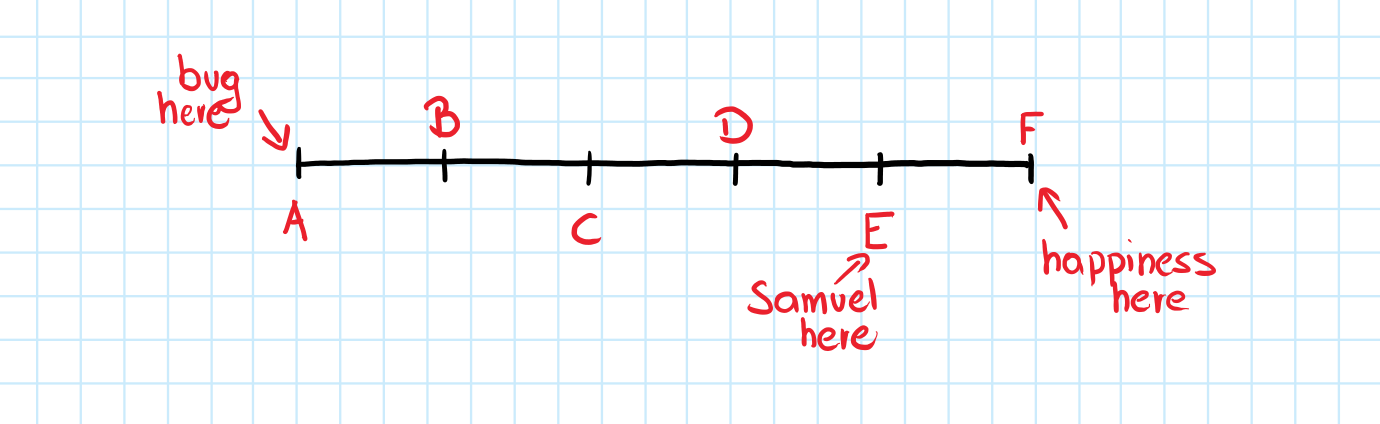
A. Find a scenario that in 100% of cases triggers the bug
Play a game until you know exactly how to bring out the issue. It is even more important in foreign code or game part you don’t remember very well. It helps you understand the code better if you already know its in-game behavior and all circumstances for the bug.
B. Use tools to find a place in the code that is responsible for it
By tools I mean the IDE features you can use to see what the code does and what are the values of variables. We’ll talk about them later. I assure you that if you find a region where the bug is located, you have more than a half of the work behind you. By region, I mean a method or methods, class or a module. All the code that is involved in the examined feature. That’s where an advice from the first part of the series, as well as the ones from the “Read it like a book – Centralized Control” article make a difference.
C. Use tools to find out what is going on there
After this one you’ll know if the place you have found in ‘B’ is the one that causes the bug. If not, repeat ‘B’ and ‘C’ until you find the bug. I’ll show you the example of ‘C’ in a moment.
D. Fix it
After a couple (of dozens) of ‘B’-‘C’ iterations, you’ll know your enemy. Fix it. It may be a simple change from ‘<‘ to ‘<=’ or it may require some refactoring. You’ll probably know.
E. Use tools to find out if it looks okay now
Basically, you have to repeat the ‘C’ to see if the code looks correct now. A pretty common mistake is avoiding this point and going straight to the ‘F.’ However, missing the ‘E’ leads to the trial and error loop that may last as well five minutes as five hours or even days. If you already made the ‘C,’ ‘E’ will be easy peasy. I’m guilty of that mistake sometimes, but until now I’ve worked out a Samuel L. Jackson-like signal in my head that says “Stop. Right. There, you motherfucka’ motherfucka’” Yeah, I’ve got that alarm, I’m not joking. It backs me on the right path.
F. Test it in the game
Play the scenario from the ‘A’ couple of times, and check if related features didn’t break. If the codebase is large, even if it is wonderfully written, the change can entail some unwanted flaws. It is worth to check it now when you’re “in the code.” It will be cheaper to fix it now than later.
Easy to use tools and real-life example
I’m using Visual Studio 2017 Community here. The functions I’ll show below look much the same in previous versions, and they are present in most (if not all) nowadays’ IDEs.
I’ll show you a real bug from my project and the workflow of fixing it.
First, I’ve observed such a behavior of an enemy.
I’ve found that this “dancing” happens when the enemy sees the player and then the player runs away (step ‘A’). Since the enemy behavior utilizes Finite-State Machine pattern, the issue may be related to the one of its states – ChasingState. I put some breakpoints here and there (step ‘B’).
Breakpoints mark the lines of code where the game should pause, so we will be able to check what are the variables’ values at that point. From these breakpoints we can start going through the code step by step, and see the flow of the application. When we marked the suspicious places already, let’s launch a debugger.
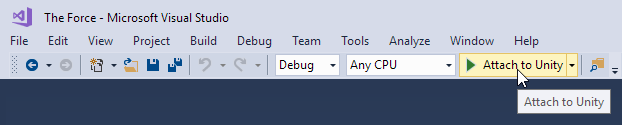
Yes, it’s as simple as that. In other IDE’s it may look a bit different, and maybe it is called “Start Debugging” or so, but you’ve got the idea.
With a debugger running, we can start our game in the editor, and we repeat the scenario we found during step ‘A.’ Then, the game pauses and Visual Studio shows up.
Yellow background highlights the line that will execute. after we move to the very next line. It means that the highlighted one is waiting for execution, yet. In the meantime we can check, what the variables look like.
Using the navigation buttons (or shortcuts) we can move as the code execution moves.
These buttons are:
Continue (F5) – resumes the game and stops it on the next breakpoint.
Step Over (F10) – Executes highlighted line and goes to the next one.
Step Into (F11) – Same as F10, but when the highlighted line is a method call, it moves onto it.
The next highlighted line will be the first line of this method. I’ve used these navigation shortcuts to check, what is going on there (step C).
There are two iterations – during one GIF play, we’re going into IsCheckpointReached() twice.
I stepped into IsCheckpointReached() method by pushing F11 (using F10 would move me to line 119 or 121 depending on if statement’s result). During the first pass, the first ‘if’ statement in IsCheckpointReached() was false. The execution moved to the line 122. I pushed F5 (Continue). After this, the next highlighted line was 117. It was the IsCheckpointReached() again (as in that time I had only one breakpoint set), but this time during the next frame. During the second pass, I’ve noticed that enemy reached X and Z coordinates (taking the error into account), but not Y. Since this enemy cannot jump or climb, checking Y is just wrong. Knowing that I could move to the step ‘D’ – fixing. I’ve introduced a new IsCheckpointReached() method (with suffix ‘2D’), for the enemies that cannot jump and I’ve replaced the current function occurrences (found by clicking on the method and pushing Shift+F12 – Find All References) with this new version.
    ///
<summary>
    /// Indicates if the checkpoint has been reached or not. Takes distance error into account.
    /// 2D version of the method. Y axis is not checked.
    /// </summary>

    /// <param name="enemy"> Enemy that is checked. </param>
    /// <param name="position"> Position of the checkpoint. </param>
    /// <param name="errorDistance"> Error distance that can be made for X and Z axis. </param>
    /// <returns>True - checkpoint reached, false - otherwise. </returns>
    protected bool IsCheckpointReached2D(TEnemy enemy, Vector3 position, float errorDistance = 0.0f)
    {
        if (Math.Abs(position.x - enemy.transform.position.x) > errorDistance) return false;
        if (Math.Abs(position.z - enemy.transform.position.z) > errorDistance) return false;

        return true;
    }
I’ve checked the code (‘E’), as I could forget about something (‘something’ is a good word here – you usually cannot name things you forgot about) and then I’ve checked the enemies behavior in the game. It worked, character stood still after losing the player out of his sight. Maybe it is not the smartest AI behavior, but now it needs improvements, not fixes.
There is one more tool I wanted to show you. A wonderful one. It’s called Call Stack and thanks to it, you can see how the game flow looked like until currently highlighted line. It will show you the list of method calls that led to this point.
It is especially useful when you need to know WHY something happened. Why is this method being called?
I’ve used different code because the above one only had two positions on the list. Also, the new Visual Studio seems to have an issue, so it shows Call Stack twice. Maybe someone should debug it?
There you have it! I hope you like it. I got a lot of amazing feedback recently. I wrote it down as bullet point list, and I read it during writing to improve the text. I appreciate it. Thanks to your suggestions I can do better and better. Join our community, that believes or feels that better coding is crucial for making great games. It is easier this way, once you prove it to yourself. So prove it. I’ll do my best to help you with that, but I need your voice. Follow Games Architecture however you like and let’s make some great games together.
Leave a Reply